Debugging
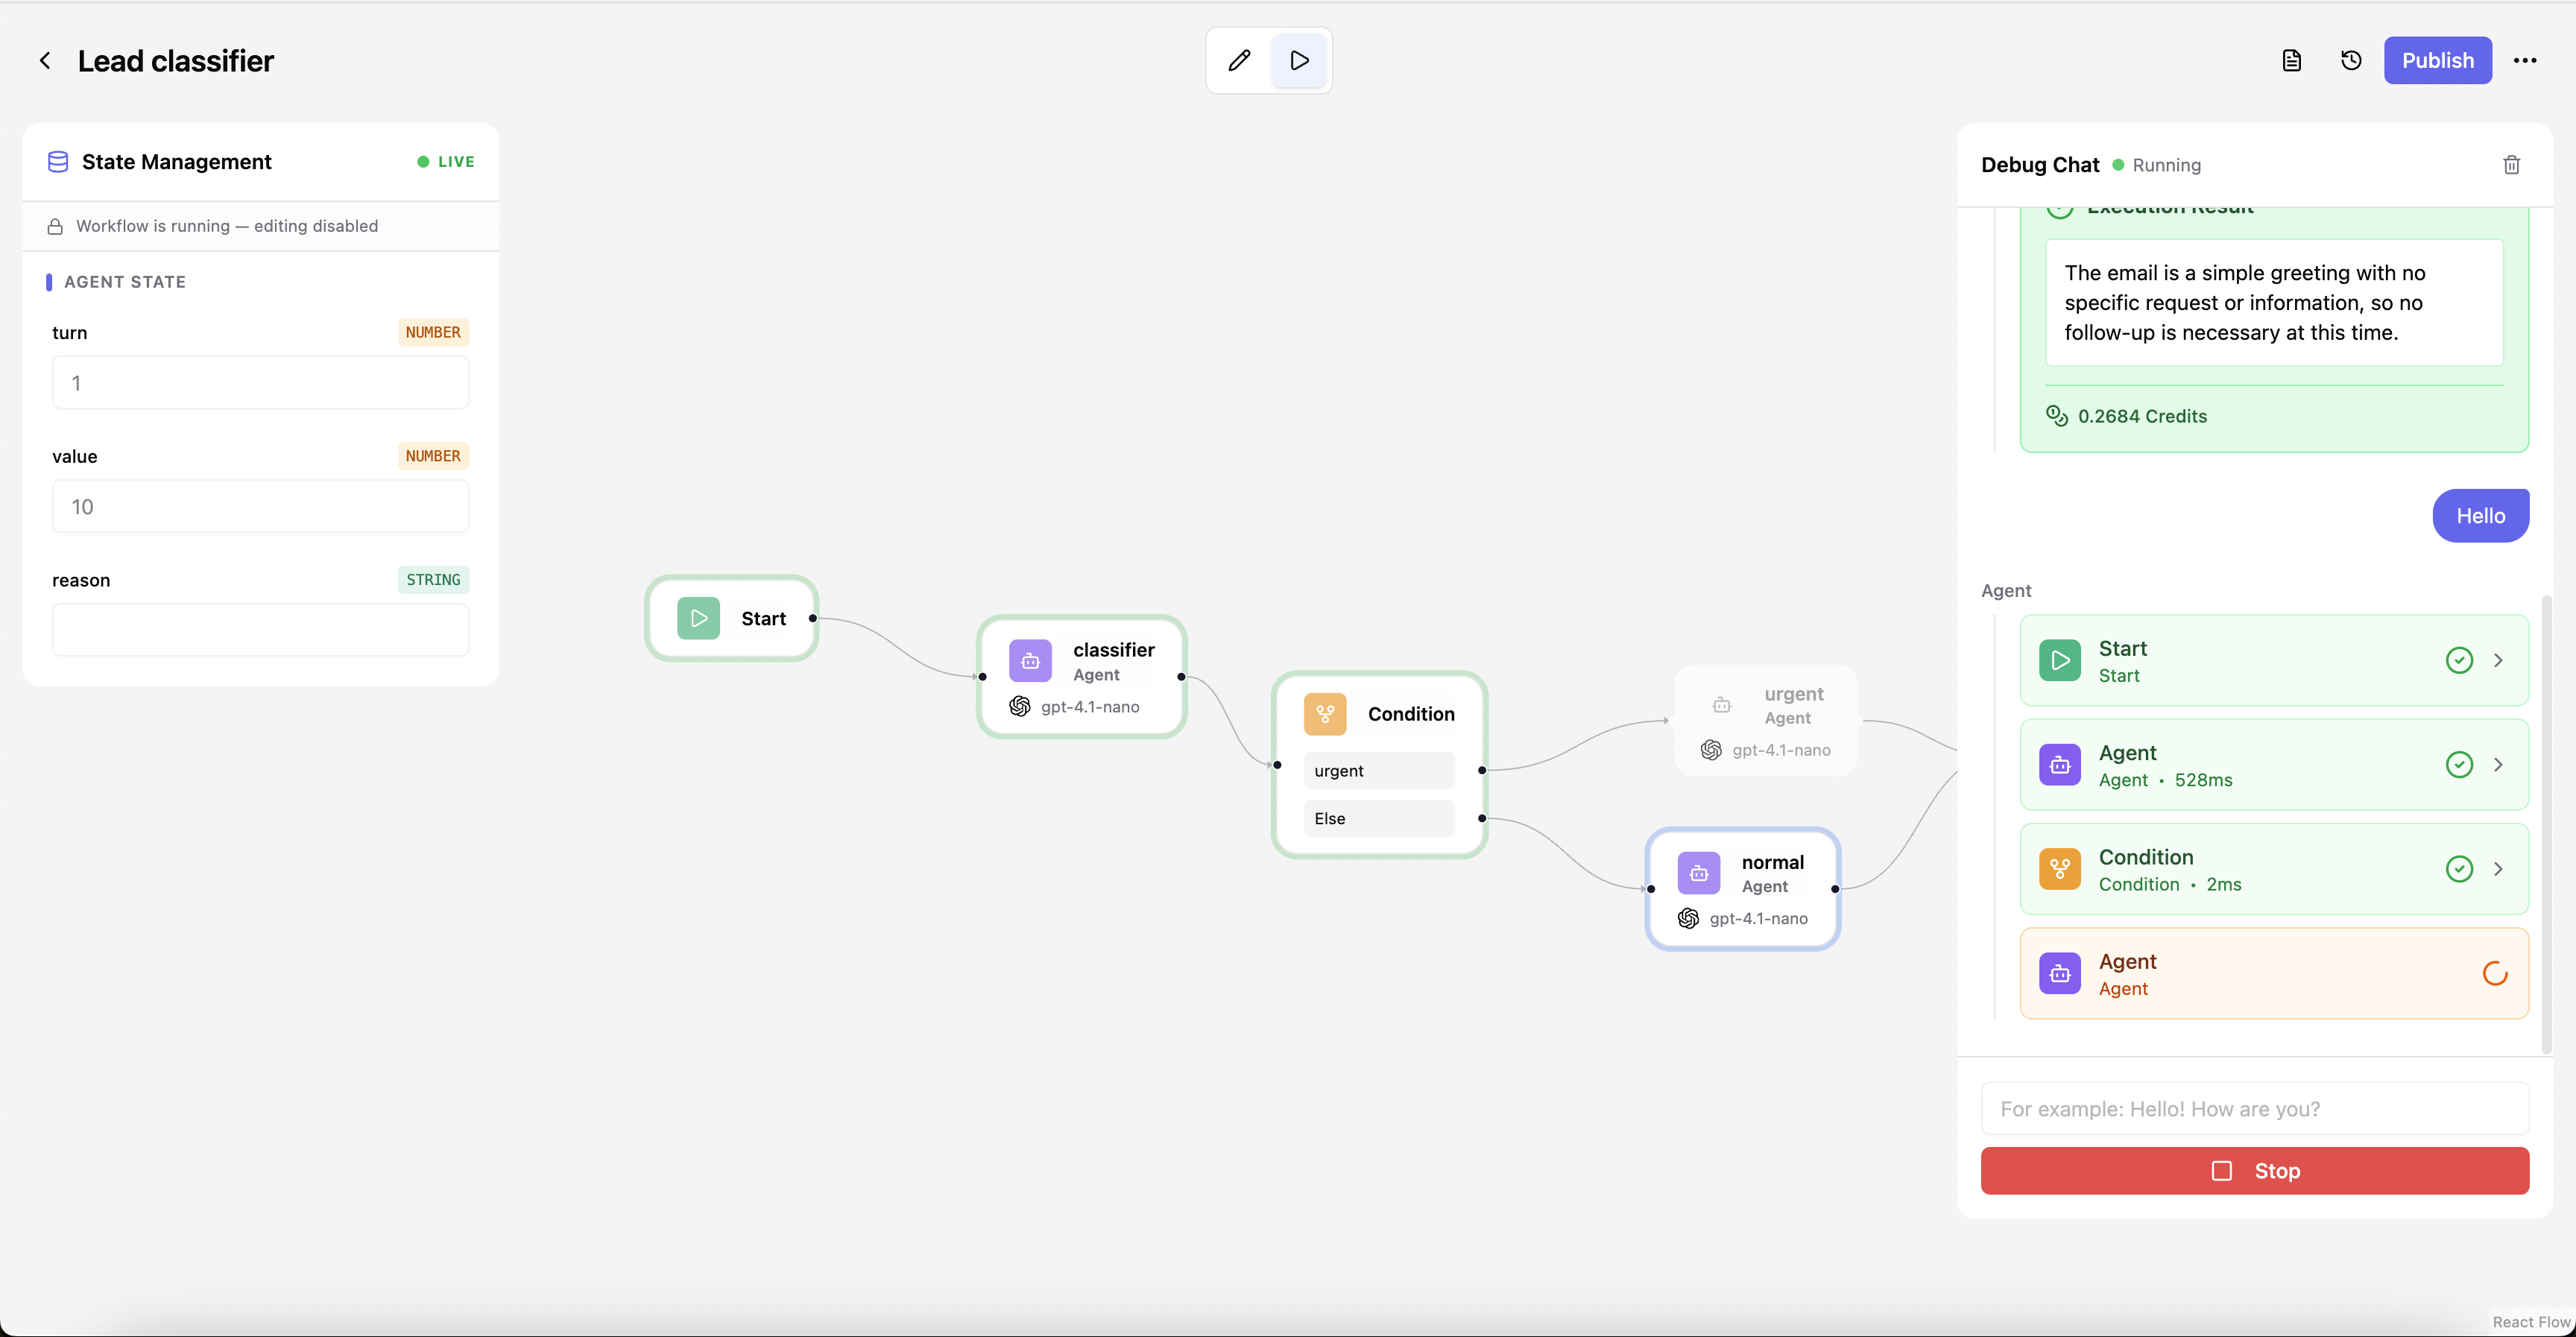
While a normal run gives you only the final answer, debug mode lets you watch a workflow execute step by step from the editor — node events stream in live, you can inspect each node's input/output and the run's state as it changes, and edit the initial state before you run. It's how you build and troubleshoot a workflow before exposing it.
Debug runs are special in three ways: they're flagged is_debug, they're unbilled (no
credits consumed), and they're hidden from the normal executions list — so you can iterate
freely without polluting your run history.
Running in debug
A debug run streams its events as they happen instead of returning a single response at the end:
POST /api/workflows/{workflowId}/execute/debug        # returns text/event-stream (SSE)
POST /api/workflows/{workflowId}/execute/debug/audio  # same, with voice input
The response is a Server-Sent Events (SSE) stream — a long-lived connection over which the
server pushes one event per thing that happens. Each event carries a monotonically increasing
seq used as the SSE id:, so if the connection drops you can resume from exactly where you
left off (send the last seq back as Last-Event-ID). The event types:
| Event | When it fires | Key payload |
|---|---|---|
step_start |
A node begins running | node id/type, the input it received, state before |
step_complete |
A node finishes | node output, status, state after, timing, model/tokens/cost |
stream_delta |
An agent emits a token chunk | the delta text (with an avatar flag when driving an avatar) |
audio_delta |
A voice-output audio chunk is ready | base64 PCM audio + optional alignment timing for lip-sync |
execution_complete |
The run finished | final output, final state, total steps/credits/duration |
error |
The run failed | error message, type, and the node that failed |
This is the same event stream produced by a regular run started with stream: true (see
Executing workflows → Streaming); debug mode simply
turns it on automatically and adds step-level detail.
In the editor
You rarely handle the raw SSE stream yourself — the editor's debug panel consumes it and turns it into an interactive view:
- Run + live chat — type (or speak) an input and watch the conversation stream back turn by turn, exactly as an end user would experience it.
- Per-node step trace — expand any node to see the exact input it received and the output it produced, so you can pinpoint where a run went wrong.
- State editor — inspect and edit the initial (and current) shared state before and while running, to reproduce a specific scenario without wiring up upstream nodes.
- Live canvas status — nodes light up with their status (running, done, failed) as execution moves through the graph, giving you an at-a-glance view of the flow.
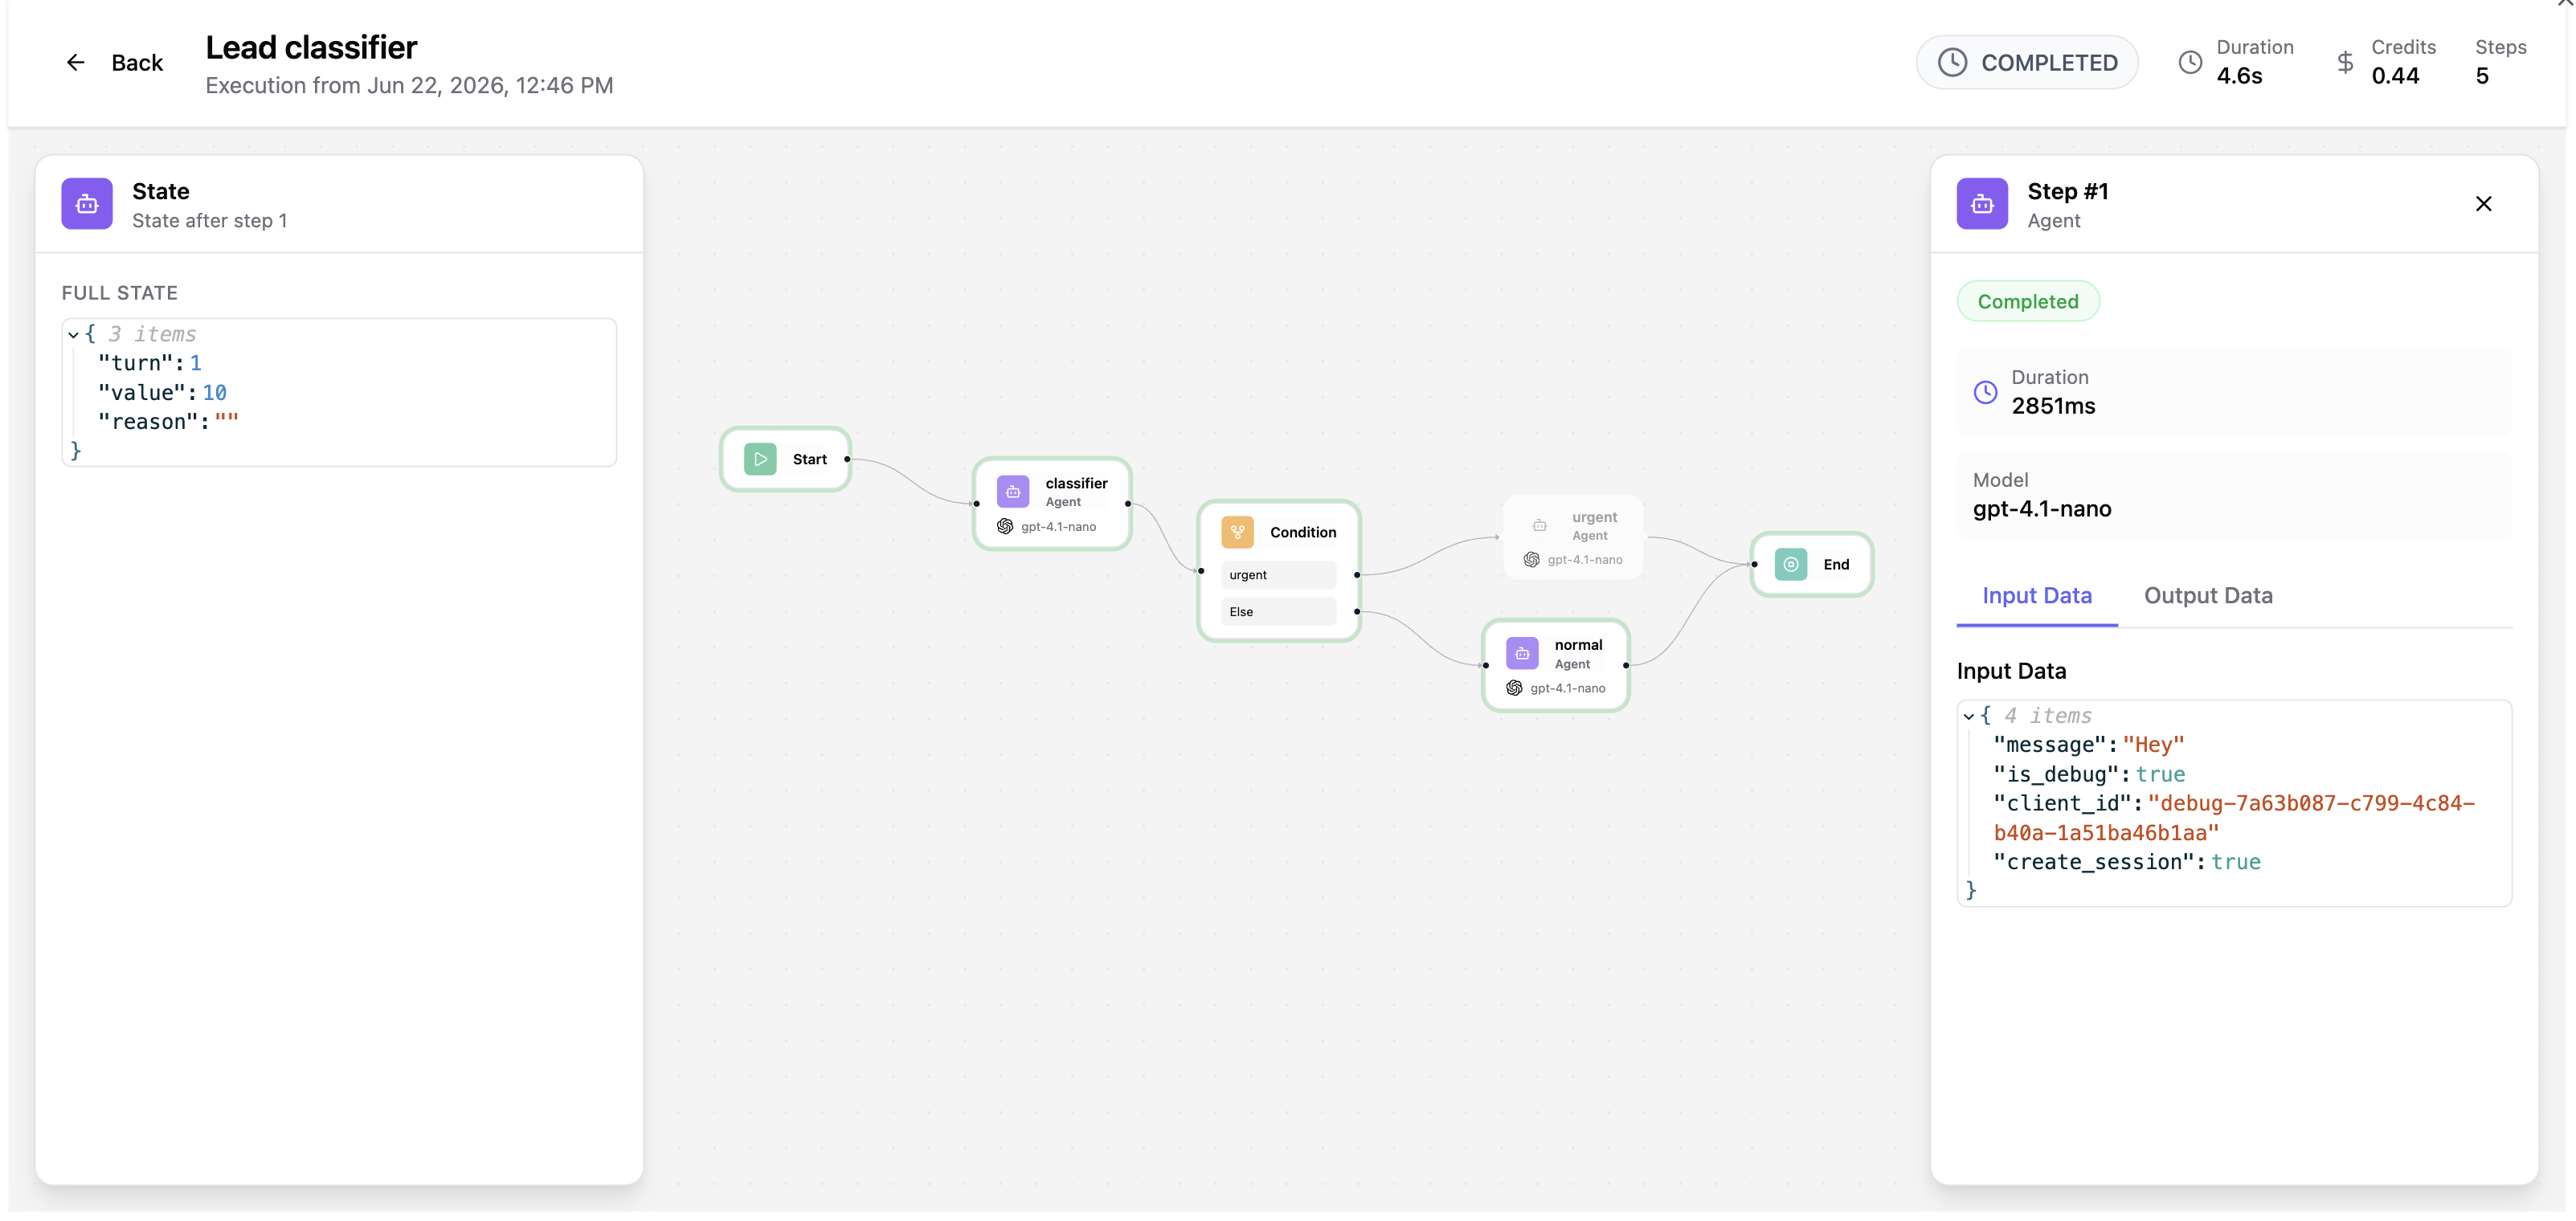
Replay and run history
Debug mode is for live iteration; once a workflow is running for real, you'll want to review past runs and monitor active ones. Three endpoints cover that:
- Attach to a run's live stream —
GET /api/executions/{executionId}/streamsubscribes to any execution's event stream, replaying from aLast-Event-IDcursor and then tailing live. Use it to reconnect a UI to an in-progress run. - See what's running now —
GET /api/executions/in-flightlists everyRUNNING/QUEUEDexecution, for a live monitoring view. - Inspect finished runs —
GET /api/executionsreturns run history (paginated and filterable by workflow, session, client, status, or date), andGET /api/executions/{executionId}returns the full detail of a single run: everyExecutionStepwith its inputs, outputs, status, and the state snapshots. The execution viewer in the UI is built on these endpoints.